4.1 Flies learn classically in the yoked control
Wolf and Heisenberg (1991) have shown earlier (see INTRODUCTION) that
operant conditioning at the torque meter is more effective than a classical
training procedure consisting of the same sequence of pattern orientations
and heat/no-heat alternations (replay; yoked control). On the other hand,
classical training with stationary pattern orientations yields learning
scores comparable to those obtained in operant pattern learning (Fig, 4;
Brembs, 1996; Wolf et al., 1998).
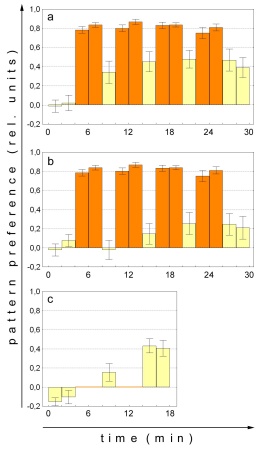
Fig. 4: Comparison of mean operant and classical
pattern learning performance indices. a - Operant master flies. N=30.
b - Classical replay flies. N=30. c Classical pattern learning with
rotating patterns (for illustration; from Brembs, 1996). Note that the
training indices are not missing but zero due to the training procedure
(see text and Brembs, 1996). N=36. Orange bars training, yellow bars
test. Error bars (as in all figures) are S.E.M.s. |
The different effects of the two classical procedures require an explanation.
In the latter experiments reinforcement is applied in a 3s 'hot' / 3s 'cold'
cycle implying that the fly is heated during 50% of the training period
(Brembs, 1996; Wolf et al., 1998). In the operant experiment the amount
of heat the fly receives is controlled by the fly. In the experiment of
Fig. 4a, for example, the fly manages to keep out of the heat for 80 to
90% of the time. If the amount of heat is taken as a measure of reinforcement
the flies in the replay experiment receive substantially less reinforcement
than the flies in the classical conditioning described above. The failure
to learn under replay conditions may therefore be merely a matter of too
little reinforcement. If this assumption were correct, prolonging the replay
procedure should overcome this shortcoming. Fig. 4 shows that this apparently
is the case. The first test after the final replay training shows a significant
learning score (p<0.04, Wilcoxon matched pairs test). Moreover, single
learning scores cease to differ after three 4min training blocks (Test
1: p<0.01 ; Test 2: p<0.05 ; Test 3: p=0.14; Mann-Whitney U-Test).
Nevertheless, a significant difference between master and replay flies
remains if all five learning scores are compared (p<0.02; repeated measures
ANOVA). In other words, it is possible for a classical (i.e. behavior-independent)
component to be involved during operant conditioning, although without
the operant behavior it is small. The fact that this classical component
was not detected in Wolf and Heisenberg (1991) is due to the low level
of reinforcement in that study. In the present replay experiment (Fig.
4) the memory score after the second 4min training block is not significantly
different from that measured by Wolf and Heisenberg (1991). To investigate
whether behavioral strategies are learned during operant training that
would facilitate retrieval of this memory trace, an extensive comparison
of the microbehavior after operant and classical training, respectively,
was performed (Brembs, 1996). These experiments strongly suggest that the
operant conditioning does not modify the fly's behavioral strategies or
motor patterns. Thus, there is no evidence that classical and operant components
merely act additively on memory retrieval.
4.2 Flies can transfer their visual memory to a new
behavior
To gather positive evidence for the behavior-independence of the CS-US
association occurring during operant conditioning, it was investigated
whether flies could be trained in one operant learning paradigm and would
subsequently display the pattern preference in a different one.
In addition to the standard operant procedure at the flight simulator
(fs-mode) a new operant paradigm at the torque meter to be called switch
(sw)-mode was used. It is based on yaw torque learning (Wolf and Heisenberg,
1991) in which the fly's spontaneous range of yaw torque is divided into
a 'left' and a 'right' domain and the fly is conditioned by heat to restrict
its range to one of the two. In the sw-mode two stationary orientations
of the panorama (or two colors of the illumination) are coupled to the
two domains. For instance, if the fly generates a yaw torque value that
falls into the 'left' domain heat is on and the upright T is in frontal
position; if the yaw torque changes to a value in the 'right' domain heat
goes off and the arena is quickly rotated by 90° shifting the inverted
T to the front (for further details see MATERIALS AND METHODS). The original
experiment without visual cues is a case of 'pure' motor learning. In the
sw-mode additionally a CS-US association may occur due to the pairing of
the visual cues with heat and no heat during training. Time course and
performance indices of two representative sw-mode experiments (one with
patterns and one with colors as visual cues) are shown in Fig. 5.
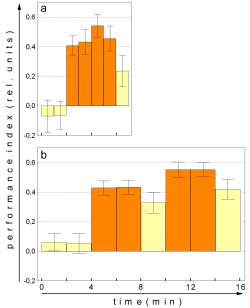
Fig. 5: Mean performance indices in two representative
sw-mode experiments. a - Patterns as visual cue (one minute PI's), N=32.
b - Colors as visual cue (2 minute PI's), N=70. Orange bars - training,
yellow bars - test. |
Although the two conditioning procedures take place at the torque meter
in the same visual surround and both involve operant behavior, they are
entirely different. While in fs-mode the choice between different pattern
orientations and the two temperatures depends on the ability to fly straight
and, above that, upon a sequence of discrete, well timed orienting maneuvers,
in sw-mode it is the actual value of the fly's yaw torque that controls
this choice. With these two behavioral paradigms the possibility of training
a fly in one mode and testing pattern preference in the other was examined.
A significant learning score after a behavioral transfer would corroborate
the hypothesis that the CS-US association formed during operant conditioning
in the fs-mode does not rely on any motor or rule learning, but instead
is a 'true' classical (i.e. behavior independent) association, the acquisition
of which is facilitated by operant behavior.
The two forms of visual discrimination learning are tested not only
with patterns (upright and inverted T) but, in a second series of experiments,
also with colors as described by Wolf and Heisenberg (1997; and MATERIALS
AND METHODS; Fig. 6). No direct transfer was observed when fs-mode and
sw-mode were interchanged between training and test, neither with patterns
nor with colors as visual cues (columns II and V in Fig. 6). Therefore,
a short familiarization training was included because flies might not easily
generalize across behavioral contexts (a similar but sensory effect was
recently reported by Liu et al., 1999, who showed that flies in the fs-mode
are unable to generalize between two monochromatic colors of illumination).
Control experiments verified that the familiarization training alone is
too short to sufficiently condition the fly (data not shown).
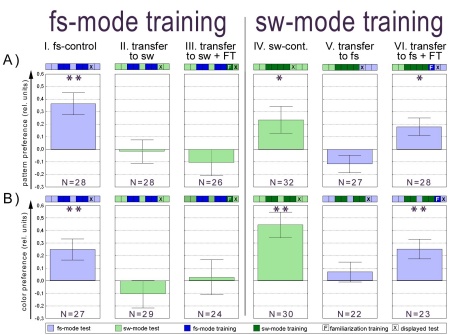
Fig. 6: Summary diagram presenting the results of
all transfer experiments. A patterns as visual cues. B colors as visual
cues. Experimental design is schematized by the 9 squares above each performance
index. All experiments are divided in 2min test or training periods, except
in A.IV-VI where 1 minute periods are used. Familiarization training is
always 60s. Statistics were performed as a Wilcoxon matched pairs test
against zero: * - p<0.05; ** - p<0.01
With this modification significant transfer was found only from sw-mode
training to fs-mode test for pattern and for color preferences (Fig. 6,
column VI: p<0.04 pattern; p<0.005 color, Wilcoxon matched pairs
test) but not in the opposite direction (Fig. 6, column III: p<0.37
pattern; p<0.78 color, Wilcoxon matched pairs test). This asymmetry
is no surprise. The life threatening heat in sw-mode training enforces
a behavioral modification that under natural conditions would be useless
in expressing pattern, color or temperature preferences. After training
in fs-mode the conditioned pattern or color preference does not have sufficient
impact to also induce this strange restriction of the yaw torque range.
It is considered more important that the memory template acquired during
training in the sw-mode is sufficiently independent of the operant behavior
by which it was mediated, to still be measurable in an entirely different
behavior. Likely, the same process as in classical conditioning is at work
in the operant sw-mode procedure. They both result in one or two memory
templates with different ratings on an attraction/avoidance scale. The
orientation behavior at the flight simulator has access to these templates.
This result holds across different sensory cues (CSs: colors and patterns)
and across slightly different training procedures (4 minutes of pattern
vs. 8 minutes of color sw-mode training).
4.3 Flies do not learn motor patterns independently
of color memory
In a three term contingency, there are always at least two predictors
that can be used to predict reinforcement, the CS and the B. In operant
pattern learning, yaw torque (B) does not have the same relation to the
US as the patterns. While reinforcement is always switched on when the
flight direction changes from the unpunished to the punished pattern, the
same flight maneuvers (i.e. yaw torque modulations) may lead to both US
onset and offset. Therefore Brembs (1996) looked for higher-order behavioral
strategies as evidence for B-US or B-CS associations. To find out whether
the operant associations are still not formed when both B-US and CS-US
are equilibrated for their predictive value and to maybe shed more light
on the asymmetry of the results from the transfer experiments described
above, a modified overshadowing (for an original overshadowing experiment
see below and INTRODUCTION) experiment was performed. In sw-mode training,
every switch from one yaw torque domain into the other changes both the
color of the arena illumination and reinforcement. Thus both yaw torque
domain (B) and colors (CS) are share the same predictive value for the
US. Isolating the single B-US and CS-US associations after sw-mode training
by either replacing the switching color filters with continuous arena coloration
or by replacing yaw torque domain with flight direction (i.e. fs-mode),
respectively, in the subsequent test phase will reveal the amount of associative
strength accrued to the single predictors. Since one part (the test for
behavior-independent CS-US association) is also part of the transfer experiments,
the data have been incorporated into Fig. 7: color memory can be retrieved
in fs-mode after a 1 minute familiarization training (Fig 7e, g). In contrast,
removing the color filters after sw-mode training abolishes yaw torque
modulation completely (Fig. 7f, p=0.706, Wilcoxon matched pairs test) and
cannot be restored by a 1 minute familiarization training (Fig. 7h, p=0.141,
Wilcoxon matched pairs test). This effect is not due to a visual context
generalization decrement, as the removal of switching colors without relation
to the fly's behavior does not disrupt performance (Fig. 7b, p<0.05,
Wilcoxon matched pairs test). As this treatment does not lead to significantly
different learning scores than regular yaw torque learning (Fig. 7a; p=0.871,
Mann-Whitney U-test), these data were pooled and compared to the sw-mode
control group (Fig. 7d). Although there is a tendency for sw-mode to yield
higher PI's than yaw torque learning and the subjective impression upon
observing the experiments is that sw-mode training is easier to accomplish
than pure yaw torque training, this effect fails to reach significance
(p=0.121, Mann-Whitney U-test). The reversal of the contingencies between
yaw torque domain and color (Fig. 7i) is arranged such that positive learning
scores indicate a dominance of yaw torque over colors and vice versa. The
tendency for yaw torque to dominate over colors if both are arranged in
a reversed contingency (as compared to the training), fails to reach statistical
reliability (p=0.085, Wilcoxon matched pairs test).
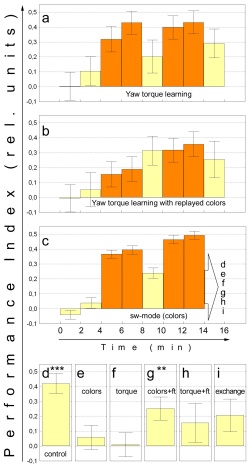
Fig. 7: A modified overshadowing experiment with
yaw torque and colors as elements of the compound. a Yaw torque learning,
arena coloration BG18. N=30. b Yaw torque learning with arena coloration
recorded from the flies used in c and played back for the first 14 minutes
of the experiment. The last test was performed using BG18 as constant color
filter. N=30. c Pooled sw-mode data of all flies tested for individual
associations. The final 2 minute test periods of the sub groups in this
experiment are depicted in d-i. N=250. d Sw-mode control. N=70. e Test
for color learning in fs-mode. No familiarization training. N=22. f Test
for torque modification. The color filters have been replaced by a BG18
filter. No familiarization training. N=73. g Test for color learning.
60s of fs-mode familiarization training after sw-mode training prior to
testing (not shown). N=23. h Test for torque learning. 60s of familiarization
training with BG18 after sw-mode train-ing prior to testing (not shown).
n=30. i Conflicting pre-dictors. Colors and yaw torque range contingencies
have been reversed. Reversal was such that positive scores would indicate
correct yaw torque modulation and negative scores correct choice of colors.
N=32. Statistics were performed as a Wilcoxon matched pairs test against
zero: *** - significant at p<0.001; ** - significant at p<0.01. Orange
bars training, yellow bars test. |
4.4 Properties of associative stimulus learning in
flies
It has been shown earlier that Drosophila readily learns to distinguish
different visual patterns in an operant learning paradigm (Wolf and Heisenberg,
1991). Using a similar setup, Wolf and Heisenberg (1997) later demonstrated
that flies also can use switches between two colors at certain arena orientations
as 'landmarks' and can be trained to avoid and prefer arena orientations
associated with one or the other color. Not unexpectedly, Drosophila also
learns colors and patterns if these are presented as compound stimuli (Fig.
8a, b). Again, the question is which of the two possible CS-US associations
are formed? Is one association dominant over the other as in the modified
overshadowing experiment described above, where the two associations were
B-US and CS-US, respectively? This question is tackled in exactly the same
way as in the experiment described above: isolation of the single associations
by removing either one of the stimuli after compound training (CS1+CS2+US).
4.4.1 No 'overshadowing'
If the fly during training is presented a compound CS of colors and
pattern orientations and is subsequently tested with the component stimuli
separately, four different results are theoretically possible. (1.) The
fly might consider both components inadequate predictors of the US; it
might use (2.) only the colors, (3.) only the pattern orientations, or
(4.) colors as well as pattern orientations. Four groups of flies are arranged
that all received 8 min of compound training during the first 14 min of
the experiment (Fig. 8a).
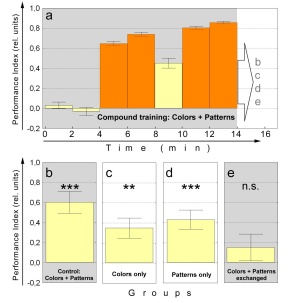
Fig. 8: Overshadowing experiment with patterns
and colors as elements of the compound. a Pooled compound training data
of all flies used in this experiments. The last 2 minute test period of
each subgroup is depicted in b-e. N=103. b Compound control. N=25. c
Colors alone. T-Patterns have been replaced by 4 vertical bars. N=28.
d Patterns alone. Color filters have been removed. N=25. e Nonsense
com-pound. The contingencies between patterns and colors have been reversed
such that positive scores would indicate cor-rect color choice and negative
scores correct pattern choice. N=25. Statistics were performed as a Wilcoxon
matched pairs test against zero: *** - significant at p<0.001; ** -
significant at p<0.01. n.s. not significant. Orange bars training,
yellow bars test, shaded areas compound stimulus, blank areas single
stimulus.
In a subsequent 2 minute test phase, the first (control) group is scored
for the compound (Fig. 8b). The second and third groups are provided with
colors alone (Fig. 8c) and patterns alone (Fig. 8d), respectively (experimental
groups). The fourth group is presented a new compound in which the contiguity
between colors and patterns is reversed (Fig. 8e). This reversal is arranged
such that positive learning scores would indicate a dominance of colors
over patterns and a negative score the opposite.
A Kruskal-Wallis ANOVA test over all four groups reveals a significant
difference between groups (p<0.006), encouraging a more detailed analysis.
The control group (Fig. 8b) shows a large performance index. The difference
between the control group and the group tested with the reversed pattern/color
contiguity is highly significant (Fig. 8e; p<0.003, Mann-Whitney U-test).
Moreover, a Wilcoxon matched pairs test confirms that the learning scores
for the control group and both experimental groups are significantly different
from zero (p<0.001 - control, p<0.005 - colors alone, p<0.001
patterns alone), whereas the reversed color/pattern contiguity did not
lead to a significant performance index (p=0.23). The two overshadowing
groups do not differ significantly from each other (p=0.47, Mann-Whitney
U-test), but the group that was presented colors alone (Fig. 8c) differs
significantly from the control group (p<0.006, Mann-Whitney U-test).
The difference between patterns alone and control just fails to reach significance
(p=0.07, Mann-Whitney U-test). One can thus conclude that presenting the
individual stimuli alone after binary compound training of patterns and
colors in the Drosophila flight simulator leads to intermediate, but nevertheless
significant learning scores that do not differ from each other. Consequently,
it is in principle possible for two predictors to accrue the same amount
of associative strength and the results showing overshadowing when a stimulus
is compounded with a behavior to form a composite predictor (see above)
are not due to a general process always selecting only one out of the possible
predictors. This result is also essential for obtaining interpretable results
in the experiments below.
Once it is clear that none of the two CSs 'overshadows' (Pavlov, 1927)
the other, one might assume that there never is any interaction between
two stimuli at all, i.e. that the components of a compound stimulus gain
or lose associative strength independently with reinforcement or nonreinforcement
of the compound (Hull, 1929; Spence, 1936). To test this assumption, blocking,
second-order conditioning (SOC) and sensory preconditioning (SPC) experiments
were carried out.
4.4.2 No blocking
Two blocking experiments were performed that differed in the amount
of compound training and the choice of control procedures (see MATERIAL
AND METHODS). As the outcome is essentially the same, only one of them
is presented here in detail (Fig. 9). In this experiment, the final test
during the pretraining phase and the carry-over in the first compound test
phase of the blocking group do not differ between the two half experiments
(pretraining colors and pretraining patterns) (p=0.08; between groups effect
in a repeated measures ANOVA over both periods and both half experiments).
Therefore, these two half experiments are presented together (Fig. 9a).
The same evaluation yields a significant within groups effect (p<0.008),
indicating the difference between the last test during pretraining and
the carry-over in the first compound test phase to be statistically reliable.
The corresponding control half experiments (Fig. 9b, c) were not pooled,
because two different procedures were used for the first training phase
(see legend to Fig. 9 and MATERIAL AND METHODS).
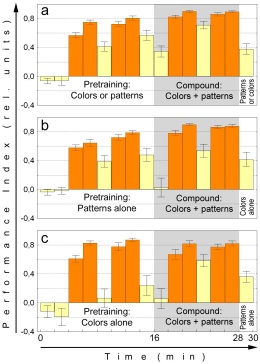
Fig. 9: A representative blocking experiment.
a Pooled half experiments with colors and patterns (with BG18 filter)
during pretraining, respectively. N=53. b Control group with patterns
(white light) during pretraining. N=27. c Control group with colors (replay)
during pretraining. N=26. Orange bars training, yellow bars test, shaded
areas compound stimulus, blank areas single stimulus.
In vertebrates several criteria have been found to be crucial for blocking.
One is the equivalence of the two stimuli - i.e. no or little overshadowing
should occur. This criterion was shown to be met in the present case (Fig.
8). Another essential criterion is the high predictive value of the pretrained
stimulus. In operant conditioning it is not possible to verify a predictive
value of 100% of a stimulus as there is no reflex-like relation of a response
with a stimulus. Rather, the animal exhibits active behavior and controls
its stimulus situation by trial and error (for a discussion of operant
behavior and initiating activity see Heisenberg, 1983; Heisenberg, 1994).
Therefore, pretraining is performed until an asymptotic level of performance
is reached. Prolonged operant pattern learning determined this level to
be reached after 4x2 minutes of training (see Fig. 4). This amount of training
is used in the compound phase for the blocking experiment presented here
(Fig. 9a-c).
The relevant difference between the experimental and control groups
is the carry-over from the performance index in the last test period of
the first training to the first test with the compound stimulus. In the
experimental group (Fig. 9a) this carry-over should be large (i.e. the
generalization decrement should be small), indicating that the reinforcer
is well predicted by the compound. In contrast, there should be no significant
performance index in the control groups (Fig. 9b, c). A Wilcoxon matched
pairs test confirms that the control animals were naive to the compound
(p=0.79), whereas the performance index in the experimental group is highly
significantly different from zero (p<0.0002). Moreover, comparing the
intermediate test period during the compound training phase between experimental
and control groups, the experimental group still shows better avoidance
than the control groups (p<0.045, Mann-Whitney U-test), indicating that
the US was still better predicted in the blocking than in the control group.
Despite the fact that all requirements for blocking seem to have been met,
the final learning score is indistinguishable between the experimental
and control groups (p=0.77, Mann-Whitney U-test) giving no indication of
blocking. The same holds true for the second experiment in which the compound
training phase was reduced to 4 minutes and the control groups were spared
the first training phase with the single CS (CS1+US) in order to exclude
any possible predictive value of US experience (data not shown).
4.4.3 Second-order conditioning
SOC is very similar to a blocking experiment. Again, after the training
with the single stimulus (CS1+US) the compound is presented. However, compound
presentation is not accompanied by reinforcement (CS1+CS2). In the training
phase, CS1 is supposed to acquire the response eliciting properties of
the US and might therefore be able to serve as a second-order US for CS2
during the compound presentation. However, the presentation of the compound
without heat after the conditioning may lead to extinction of the learned
association attenuating the CS1-US association. It has been shown above
that in our paradigm operant learning needs considerably less training
than classical learning (Fig. 4). Given the equivalence of the acquisition
and extinction time constant, one might expect extinction to be very fast
in our operant setup as well. Additionally, extinction might even be facilitated
by the second stimulus (CS2) signaling non-reinforcement of the compound
(CS1+CS2). Despite these considerations the test for SOC was carried out.
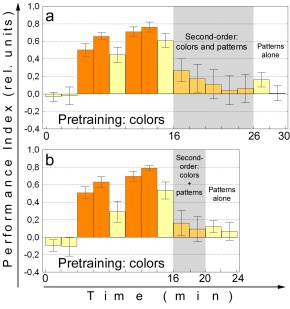
Fig. 10: Second-order conditioning. a
Second-order experiment modeled after the first blocking experiment (depicted
in Fig. 7). N=20. b Second-order experiment modeled after the second
blocking experiment (not shown). N=22. Orange bars training, yellow bars
test, yellow-orange bars second-order training (no heat), shaded areas
compound stimulus, blank areas single stimulus.
Only colors were used as CS1 assuming color might be a better second-order
US than pattern orientation. The experiment was performed twice, with 10
and 4 minutes of second-order training. Both yield only small second-order
learning effects that are statistically reliable only if the PIs of the
two experiments are pooled (p<0.02; Wilcoxon matched pairs test; p=0.08
for both experiments separately). The steep extinction curve is the most
likely explanation for the small second-order learning effect. Already
in the first 2-min period of the second-order training phase avoidance
of the color previously combined with heat is down to about PI=0.2, from
PI=0.6 for color alone after the initial training. Again only pooling the
data of the two experiments (Fig. 10a+b) yields a statistically significant
difference to zero (p<0.02, Wilcoxon matched pairs test). For the second
2-min period, even pooling the two experiments fails to produce a statistically
reliable performance index (p=0.15, Wilcoxon matched pairs test). Taken
together, a small SOC effect was found that is small presumably because
the CS-US association is rapidly extinguished during the second-order conditioning
phase.
3.4.4 Sensory preconditioning
Formally, SPC is the temporally reversed analogue of SOC. In SPC the
exposure to the compound (CS1+CS2) precedes the training (CS1+US). Hence,
no extinction can occur between training and test. Flies are exposed to
16 minutes of unreinforced flight at the flight simulator in an arena where
flight directions are designated by compound stimuli consisting of colors
and patterns (CS1+CS2). If immediately afterwards one of the stimuli is
paired with heat (CS1+US), even the other one (CS2) is regarded as a predictor
of safe and dangerous flight orientations in the subsequent test (Fig.
11b). No statistically significant learning score is observed in the final
test with only 10 minutes of preconditioning (Fig. 11a). The difference
between the learning scores after 10 and 16 min is statistically significant
(p<0.01, Mann Whitney U-test). In each of the two experiments (Figs.
11a, b) the two half experiments (using colors or patterns as CS1, respectively)
yielded statistically indistinguishable results, justifying the pooling
of the corresponding data sets.
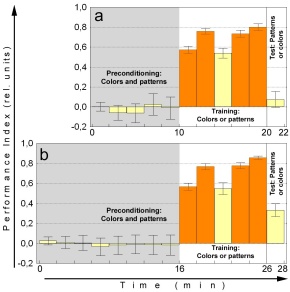
Fig. 11: Sensory preconditioning experiment. Each
half experiments have been pooled. a 10 minutes of preconditioning. N=56.
b 16 minutes of preconditioning. N=56. Orange bars training, yellow
bars test, shaded areas compound stimulus, blank areas single stimulus.
|